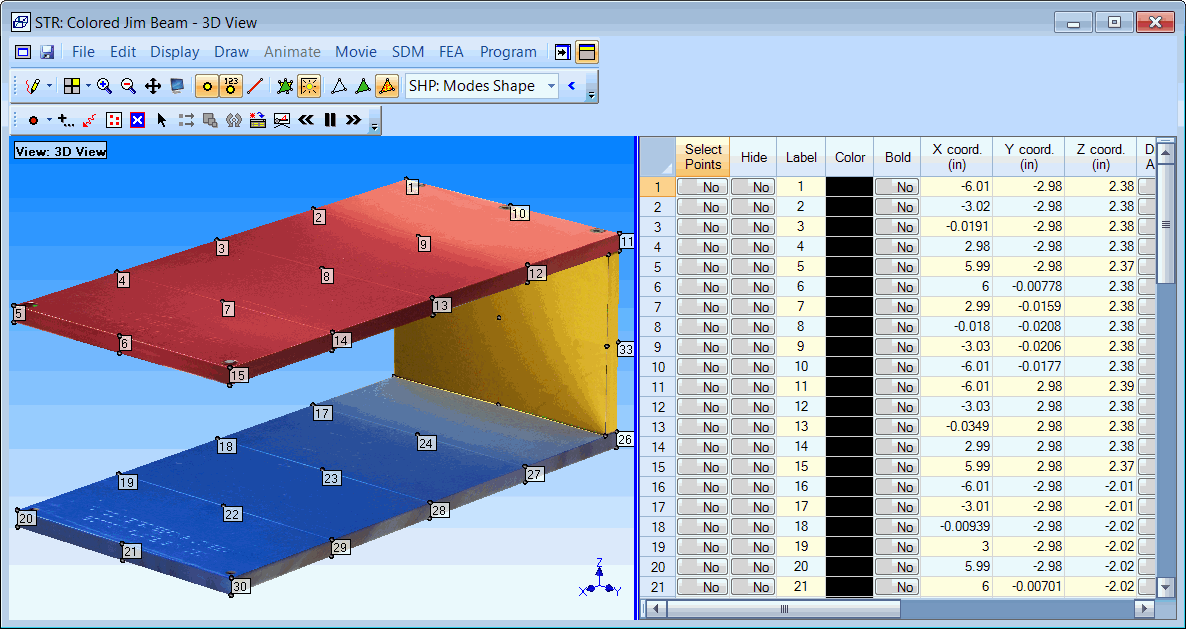
Lists the properties of all Points on the structure model.
The Points spreadsheet is displayed by selecting Points from the Edit | Current Objects List.
Only Points are required for displaying shapes in animation. Lines and Surfaces are optional.
All other drawing and FEA Objects on a model require Points as end-points to define them.
Each Point is defined by its global coordinates, (X Coordinate, Y Coordinate, Z Coordinate) listed in its row of the Points spreadsheet.
Spreadsheet columns can be re-ordered by dragging and dropping them into a new position.
Selected spreadsheet rows can be moved by executing Move Selected Objects Up/Down

Point Properties Spreadsheet.
Contains an (optional) text label for each Point.
All Points are referenced by their spreadsheet row number & [Label]. The Point Label is used to describe the Point, or for Point numbering.
Numbered Point Labels are used by the Draw | Animation Equations | Create Measured Equations command.
(See Animate | Create Measured Equations in the Data Block window commands chapter for details.)
These columns (X Coord, Y Coord & Z Coord) contain the Global rectangular (Cartesian) coordinates of each Point.
If Length units are specified on the Units tab in the File | Structure Options dialog box, those units are displayed in each Coordinate column heading.
Correct length units are not required in order to build a structure model and animate shapes with it.
To manually enter Point coordinates from the keyboard,
Click in the X, Y or Z column of the last row of the Points spreadsheet, and press the down arrow key on the keyboard.
Type the coordinates into the Point Coordinate columns in the new spreadsheet row.
If you have already copied Point coordinates to the Windows Clipboard, those coordinates can be pasted into the Points spreadsheet, provided that it has enough rows in it.
You must have enough rows in the Points spreadsheet before pasting coordinates from the Clipboard
To create extra rows in the Points spreadsheet
Click in the X, Y or Z Coord column of the last row of the Points spreadsheet, and press the down arrow key on the keyboard.
Or open any Structure window that already has rows in the Points spreadsheet.
To paste Point coordinates from the Clipboard,
Click & drag in the Points spreadsheet to select the appropriate Coordinate columns and rows of spreadsheet cells.
Hold down Ctrl and press the V key to paste the coordinates from the Clipboard into the selected cells.
Center Point : Any Point that is listed in the Center Point column of the Points spreadsheet.
Radial Point : Any Point that references a Center Point in its Center Point column in the Points spreadsheet.
Center Points are used for the following purposes;
Describing the center of cylindrical or spherical structures.
Defining the axis of rotation for rotating Substructures during animation.
A Substructure will rotate if Yes in chosen in the Rotate column of the Substructures spreadsheet. All Radial Points rotate about the Z-axis of a Center Point during Substructure rotation.
Animating Shaft Rotational measurements. (See Animating Shaft Rotational Data in the Data Block commands chapter)
Normal: Displays a Point if Points is the current Object type, or if Display | Points | Show Points is checked.
Always: Displays a Point always.
These two columns are used for calculating the Sound Power passing through an acoustic surface .
Acoustic Area: The area of the acoustic surface surrounding the Point.
Acoustic Normal: The normal vector to the acoustic surface surrounding the Point.
These values in these columns are automatically calculated when an acoustic surface it created with the Drawing Assistant .
Defines the type of animation allowed at a Point during animation.
If selected, Deformation will occur at the Point using shape data.
Animate | Deformation | Deformed must be checked for deformation to occur.
If selected, an Arrow will be displayed at the Point, indicating the magnitude and direction of the shape data.
Animate | Deformation | Arrows must be checked for arrows to be displayed.
If selected, either Deformation or Arrows, or both types of animation can occur at a Point.
If selected, the Point will not move during animation.
Displays an Icon at a Point.
Icons are useful for depicting a transducer at measurement Points. During shape animation, color contours from the animation source are displayed on each Icon.
Select the Points with Icons to be rotated.
Execute Edit | Rotate Selected Objects and check Rotate Point Icons in the dialog box.
Select the Points with Icons to be re-sized.
Execute Edit | Resize Selected Objects and click on Yes in the dialog box that opens.