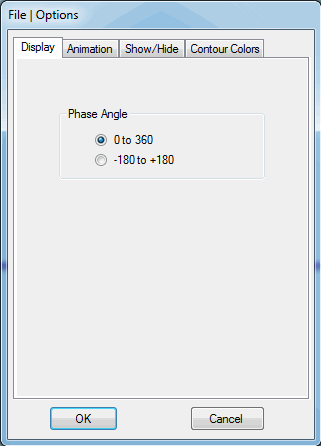
Opens the Shape Table Options box.
Many options take effect in the Shape Table window as soon as they are chosen in this Options box.

Formats for displaying shape Phase angles.
Phase angles can be displayed in the ranges (0 to 360) or (-180 to 180) degrees.
During Sweep animation, the number of Sine Dwell Cycles per Shape is executed before displaying the next shape.
If Line Color uses Shape Color is checked, the Shape color is used as the Line color during animation.
Shows or hides columns of the Shapes or DOFs spreadsheets.
Or right click on the Shapes or DOFs spreadsheet and select Show/Hide Columns from the menu.
Check columns to show them. Un-Check columns to hide them.
Contour colors are used by the following commands,
Commands in the Animate | Contours Menu in a connected Structure window.
Display | MAC .
Display | Source Rank.
Click on one of the Default buttons to assign pre-defined colors to the contours.
SubShapes are defined by entering names into the SubShape column of the Traces spreadsheet.
If SubShapes are defined in a Shape Table, then different contour colors can be defined for each SubShape
If SubShapes are not defined, Contour colors are defined for all M# s in the Data Block.
High & Low Limits are entered into the High Limit and Low Limit boxes above & below the color bar.
If the Low Limit = 50 and the High Limit = 100, then color contours will only be displayed for shape values between 50 & 100.
Values above or below the limits are displayed using the limit colors.
If shape data at a Point is only one dimensional (only one of the Animate | Direction commands is checked), then contours are displayed for shape values between Plus & Minus limits. If shape data at a Point is more than one dimensional, contours are displayed for shape magnitudes between positive Low & High limits.