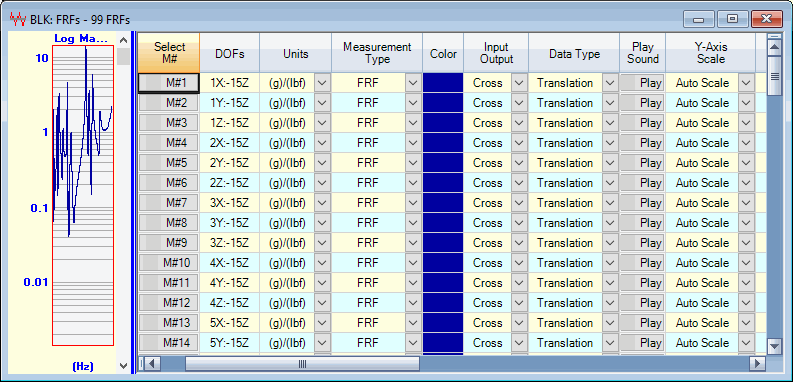
The M#s spreadsheet contains all of the properties associated with each measurement in a Data Block file.
Each row contains all properties of a single measurement
Each column contains a single property for all measurements
Some columns in the M#s spreadsheet are only made visible when certain Options are authorized in your software.
Drag the Vertical Blue Splitter Bar to the left to display the M#s spreadsheet.
Or execute Display | M#s Spreadsheet.
If the M#s spreadsheet contains more rows & columns than are currently displayed, scroll bars will appear on the bottom and right side of the spreadsheet.
Spreadsheet columns can be re-ordered by dragging and dropping them into a new position.
Selected spreadsheet rows can be moved by executing Move Selected M#s Up/Down

Data Block Window Showing M#s Spreadsheet.
Right click on any spreadsheet and execute Show/Hide Columns from the menu.
The File | Data Block Options box will open displaying the Show/Hide tab.
Check columns to show them, and Un-check columns to hide them, and click on OK.
Right click on any spreadsheet and execute Reset Column Widths from the menu.
Each measurement in a Data Block has a unique M# , listed in the Select M# column in the M#s spreadsheet.
M#s are used in the Animation equations in a connected Structure window to retrieve measurement data for displaying shapes in animation.
A selected measurement has a shaded background in the graphics area, and its Select M# button has a green background.
Right click on the spreadsheet and choose one of the Edit | Select M#s commands from the menu
Double click on the Select M#s column heading to select or un-select all M#s.
Click on the Select M#s button for an M# to select it.
Hold down the Ctrl key and click in the graphics area to toggle the selection of its M#
Right click on the graphics area, and execute one of the Edit | Select M#s commands from the menu.
Click on a property cell in the M#s spreadsheet, and edit the property of a single M#
Double click on the column heading of the property to be changed. A dialog box will open.
Choose or enter the property value, and click on OK.
Click & drag the column header to move a column to a new position
If a vertical scroll bar is displayed on the right side of a spreadsheet,
Click on the spreadsheet and spin the mouse wheel to scroll the spreadsheet vertically
To change the text size in a spreadsheet, click on the spreadsheet, hold down the Ctrl key, and spin the mouse wheel
Select one or more spreadsheet text cells
Hold down the Ctrl key and,
Press the X key to cut the selected text to the Clipboard
Press the C key to copy the selected text to the Clipboard
Press the V key to paste text from the Clipboard into the selected cells
Shows or Hides each M#.
Hidden M#s are not displayed, and are excluded from all Data Block calculations.
Contains the Measurement Type of each M#
Click on a cell in this column to display a list of available Measurement Type choices.
Contains the DOFs of each M#
Measurement DOFs are the locations on the test article (Point number and measurement direction) where the sensors were located when the measurement data was acquired.
Each DOF is either a Roving DOF (moving transducer) or a Reference DOF (fixed transducer).
Each single channel measurement (Auto correlation, Auto spectrum ) has a single Roving DOF
For example, If a sensor is located at Point 1 and is sensing in the X direction, its DOF is 1X
A cross channel measurement (FRF or Cross spectrum ), has both Roving & Reference DOFs, separated by a colon (:).
Roving Impact Test: If an FRF was measured by impacting at DOF = 1X and a (fixed) accelerometer has DOF = 2Z, then the FRF DOFs are 1X : 2Z.
Shaker Test: If an FRF was measured with a shaker located at DOF = 1X and a (roving) accelerometer has DOF = 2Z, then the FRF DOFs are 2Z : 1X.
Double click on the DOFs column header to open the DOF Generator for creating DOFs.
(See Using the DOF Generator) section in this chapter for details on using the DOF Generator
Contains the transducer engineering units of each M#..
Typical input units are excitation force units.
Typical output units are displacement, velocity, or acceleration response units.
FRF units consist of both input & output units (response output units / force input units).
Transmissibility units are (Roving response output units / Reference response input units).
Cross spectrum units are (response units)^2 or (response units * force units).
ODS FRF units are (Roving response units * Reference response units).
Contains the line color of each M#.
All measurements are displayed using their M# color, except in the Contour Map format.
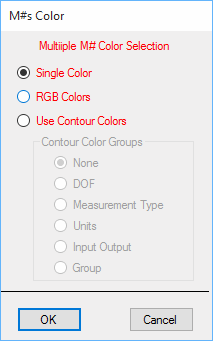
To color all (or selected) M#s using either a Single Color or the colors in the Contour Colors tab in the File | Data Block Options box,
Double click on the Color column header. The following dialog box will open.
Select a color type and click on OK.

Plays the sound of the measurement through the sound system on your computer.
If the Band Cursor is displayed, then only the samples in the cursor band are played through the sound system.
If the selected M# is a frequency domain M#, it is Inverse FFT'd before playing it through the sound system.
Contains a text description of each M#.
Contains the Data Type of each M#.
Click on a cell in this column to display a list of available Data Type choices.
Contains the scaling method used to display each M#
Displays each M# with its maximum value near the top of the graphics display.
Displays each M# relative to the maximum value of all of the M#s in the Data Block.
Displays each M# between user-specified Minimum & Maximum values.
Auto, Relative or Fixed scales can also be chosen for all (or selected) M#s in this dialog box.
Contains a text date & time of the acquisition or calculation of each M#.
Groups are used for scaling different types of shape data (such as vibration and acoustic data), so that both can be displayed together in animation.
If no names are entered in this column, all M#s are treated as belonging to the single Group.
For shape animation, contour colors can be defined for each Group. (See the Color Contours tab under the File | Data Block Options command for details.)