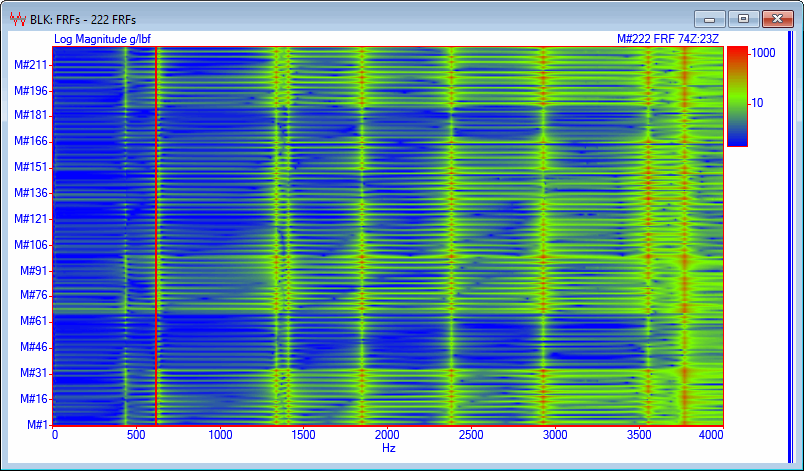
Displays all (or selected) Traces in a color contour map.
NOTE: The colors used for the contour map are chosen in the Contour Colors tab in the File | Data Block Options dialog box.
Cascade Map Showing 14 Selected Traces.
NOTE: The vertical axis is labeled using either M#s or DOFs, which are chosen in Scroll Tip section on the Labels & Grids tab in the File | Data Block Options box.