If checked, the Line cursor is displayed as a vertical red line on each M# graph.
If checked, the Band cursor is displayed as two vertical red lines (or edges) on each M# graph.
If checked, the Peak cursor is displayed as two vertical red lines (or edges) on each M# graph, and the peak sample (maximum value of the displayed data) within the cursor band is displayed as a red dot.
If checked, the cursor values are displayed in a text box next to the cursor on each M# graph.
Hold down the left mouse button to display cursor values next to the cursor.
Click & drag to move the cursor value text box vertically on the display.
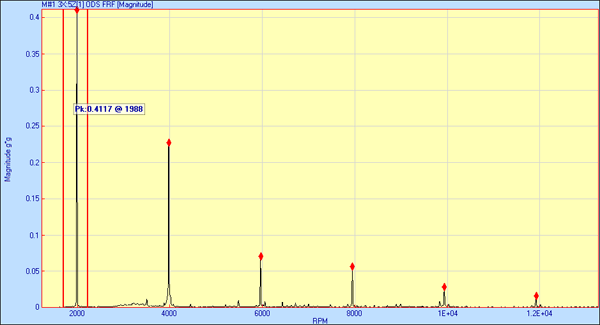
If checked, all of the visible orders (2x, 3x, 4x, etc.) of the Line or Peak cursor are displayed on each M# graph.
Each order is highlighted with a red dot at the nearest sample to the order.

Data Block Showing Order cursors.
Moves the cursor to the maximum value of the displayed measurement data.
If the Line cursor is displayed, it will move to the peak within the current cursor band.
The Peak Finder only finds the peak value within the current cursor Band. Display the Band Cursor first before using the Peak Finder with the Line cursor.
If the Peak or Band cursor is displayed, its band is centered around the peak within the current cursor Band.
Position the mouse pointer at the desired position on an M# graph, and click the left mouse button.
Or place the mouse pointer anywhere on an M# graph, and click & drag the mouse pointer.
Place the mouse pointer inside the band, and click & drag.
Place the mouse pointer outside the band near the edge, and click & drag.
With the Peak Finder enabled, click near a peak to move the cursor to that peak.
The Line, Peak or Band cursor must be displayed in order to animate shapes from a Data Block or Acquisition window in the connected Structure window.
If the Line cursor is displayed, the measurement values at the cursor position are displayed in a connected Structure window as the shape.
If the Peak cursor is displayed, the measurement values at the peak in each M# are displayed in a connected Structure window as the shape.
If the Band cursor is displayed, the measurement values in the cursor band are summed together for each M# and displayed in a connected Structure window as the shape.
The Line, Peak or Band cursor must be displayed in order to execute Tools | Save Shape.
If the Line cursor is displayed, the measurement values at the cursor position are saved into a Shape Table.
If the Peak cursor is displayed, the measurement values at the peak in each M# are saved into a Shape Table.
If the Band cursor is displayed, the measurement values in the cursor band are summed together for each M# and saved into a Shape Table.
If the Order cursors are displayed, the measurement values at each visible order are saved as a separate shape in a Shape Table.