Frequency-Based ODS Demo
-
Hover the mouse pointer over the Demos tab to display the Demos fly out panel.
-
Make sure the Help | Show Tool Tips is checked.
-
Move the mouse pointer over the Demos panel to display the Jim Beam.VTprj Project name, and double click to open the Project.
-
Execute Draw | Animate Shapes in the Structure (STR) window.
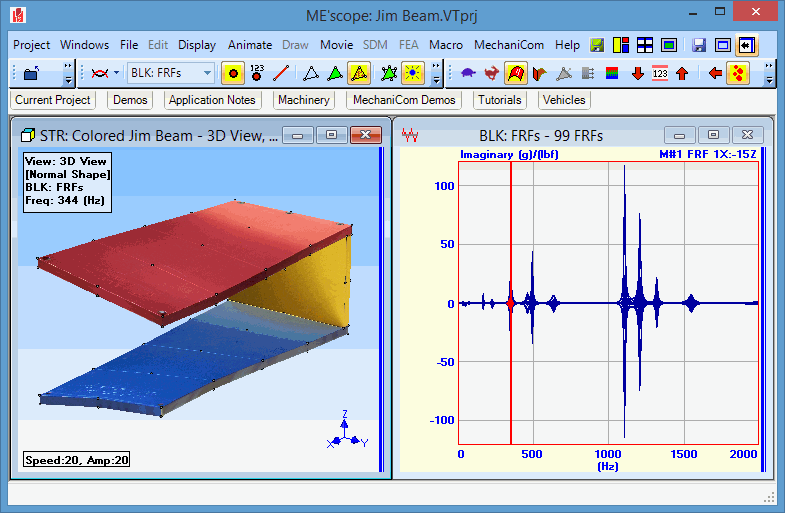
Sine Dwell animation using shape data from a Data Block will begin. Notice that the Line cursor (vertical red line) is positioned in the middle of the Data Block M#s. The 3D model is being animated with the ODS (data from each M#) at the cursor position. Sinusoidal modulation of the ODS is used to create the sine dwell animation.
-
To view each FRF measurement, drag the vertical scroll bar on the right side of the graphics area in the Data Block window.
Animating Near a Resonance
The peaks in the FRF measurements are evidence of structural resonances, or modes of vibration. At or near a resonance peak, the ODS (values of the FRFs) is being dominated by the mode shape associated with the resonance. For lightly damped structures, the ODS at or near a resonant frequency will closely approximate the mode shape. To view the ODS at a resonance,
-
Execute Format | Overlaid to display all FRFs overlaid on one another.
-
Execute Display | Imaginary  to display the Imaginary parts of the FRFs in Overlaid format.
-
Click & Drag the Line cursor in the Data Block window until it lies on or near one of the resonance peaks.
At one of the lower frequency resonance peaks, the ODS on the structure model should look like a bending or torsional mode shape of the structure.
-
Click & Drag the Line cursor to another peak, and notice how the ODS changes.

Animation at a Resonance Peak.
M# Display Formats
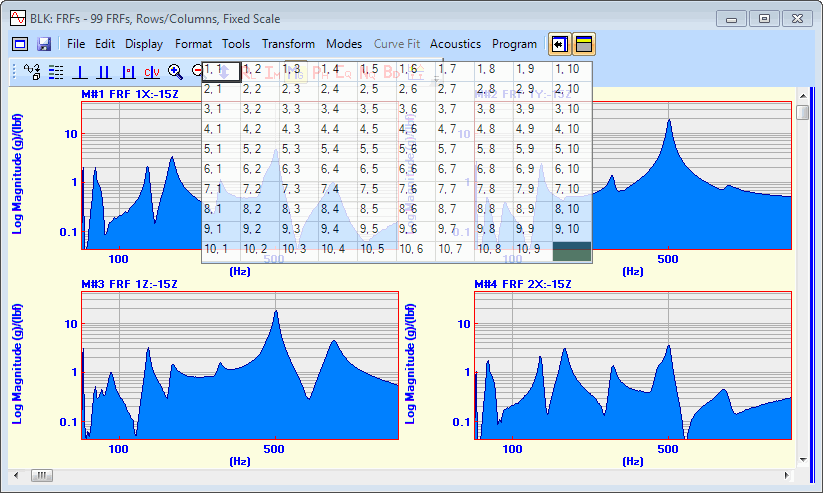
There are several different formats for displaying M#s in the Data Block window. To display M#s in a Row/Column format,
A graphical array of rows & columns will be displayed below the command.

Data Block window with Rows & Columns selection box.
-
To display 2 rows and 2 columns, choose 2, 2 from the array of rows & columns.
-
Try the other commands Strip Chart, Cascade, and Contour Map in the Format menu.
![]() to display the Imaginary parts of the FRFs in Overlaid format.
to display the Imaginary parts of the FRFs in Overlaid format.
