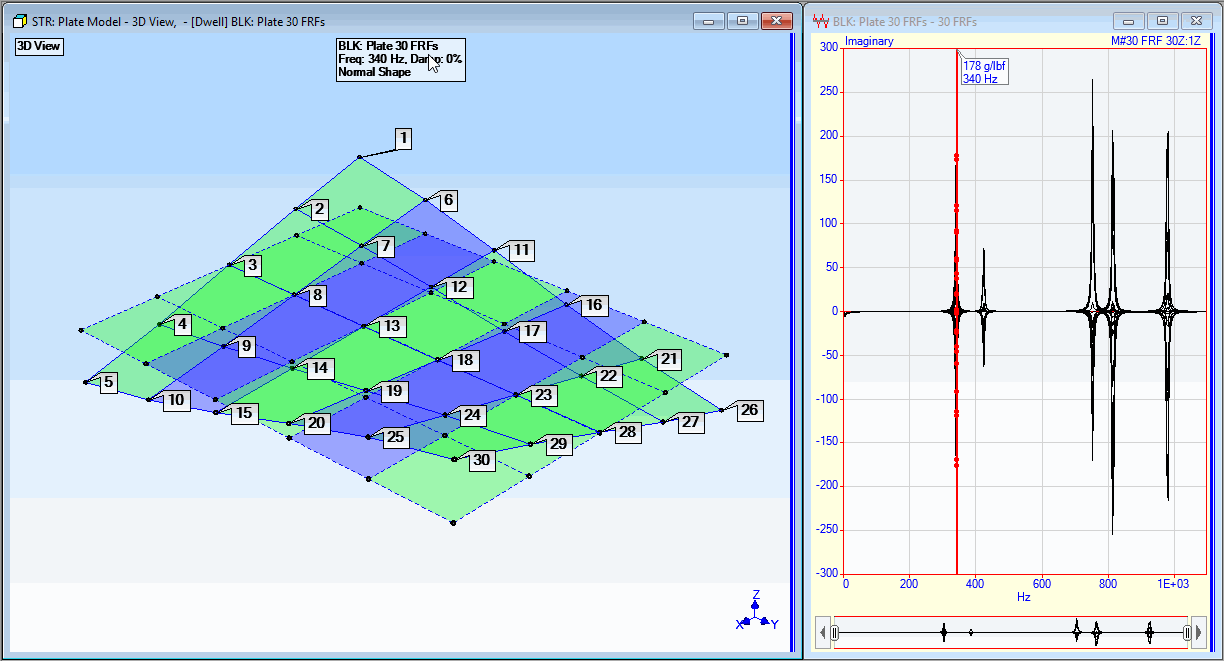
In this tutorial, we will build a model of a flat plate and display frequency-based ODS 's in animation on the model.
The following steps will be carried out to display the ODS's of the flat plate;
Create a model of the test article including all of its test points
Import FRF measurements taken from the test article into a Data Block file
Assign the FRF measurements (M# s) to points & directions (DOFs) on the model where the measurements were made
Display ODS's in animation on the plate model from the cursor position in the FRFs
Position the cursor at a resonance peak to display an approximation of the mode shape for that resonance
NOTE: When an ODS is displayed from the cursor at or near a resonant peak in a set of FRFs, it is usually dominated by the resonance and is therefore a close approximation of the mode shape associated with the resonance.

Animating an ODS at a Resonance Peak.