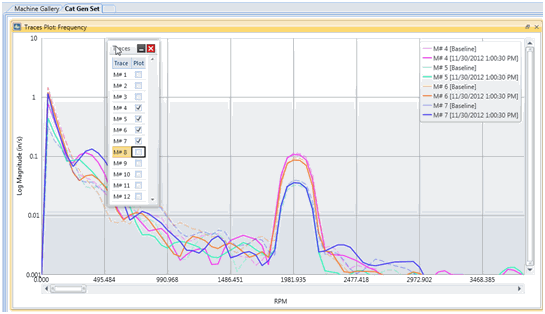
A Data Block Plot is used to display archived Frequency spectrum, Octave spectrum or Time waveforms of data that were acquired from a monitored Machine (Site or Test Article). To open a Data Block Plot panel,
Click on Data Blocks on the Home tab command ribbon
Right click on the Data Block Plot to display a menu of Data Block Plot commands.
Select Format Options to display the trace data in Real, Log Magnitude, Magnitude, or Phase format.
Expand the plot options box to select the data to display on the Data Block Plot.
Use the X axis scroll bar to change the frequency or time band on the Data Block Plot.
Use the left mouse button to draw a zoom box on a desired portion of the Data Block Plot
Spin the mouse wheel to zoom in or out on the entire Data Block Plot.
Select different plot styles from the Chart tab command ribbon.