If the VES-3600 Advanced Signal Processing option is authorized by your ME'scope license, the following commands are enabled in the Data Block and Shape Table windows
Check Help | About to verify authorization of this option.
The following additional columns are enabled in the M#s spreadsheets in Data Blocks, Acquisition windows, and Shape Tables.
Linear Power
Input Output
Peak RMS Pk-Pk
FFT
Window, Window Value, Window Correction
Z-Axis
Linear Power
Input Output
Peak RMS Pk-Pk
Z-Axis
Extra Data Block M#s Spreadsheet Column With Signal Processing Option.
Converts all (or selected) M#s between Linear & Power engineering units (EU & EU^2).
All M#s with Linear engineering units (EU) are converted to Power engineering units (EU^2), and the measurement values are re-scaled using the formula,
All M#s with Power engineering units (EU^2) are converted to Linear engineering units (EU), and the measurement values are re-scaled using the formula,
Defines an measurement either as an Input, an Output, or Both an Input and an Output to a test structure. A Cross channel measurement such as an FRF , is calculated between two DOFs of a structure and is designated as Cross in the Input Output column of the M#s spreadsheet.
IMPORTANT: Input, Output, Cross, and Both designations are used by the Transform | Spectra, Transform | MIMO and Transform | ODS FRFs commands.
Scales all (or selected) M#s using the following scale factors.
|
Amplitude Scaling Choice |
Trace Is Multiplied By |
|
Peak |
1.0 |
|
Pk-Pk |
2.0 |
|
RMS |
0.707 |
Defines the FFT (or DFT spectrum) of each M# as either One Sided or Two Sided.
The FFT calculates a Two Sided spectrum, where half of a signal is represented by the negative frequency half and half by the positive frequency half of the spectrum.
The frequency spectrum of a real valued time signal is symmetric about zero frequency (DC), so only the positive frequency half of the spectrum is displayed.
The amplitude & power values for a One Sided FFT are the same values as its corresponding time domain signal.
The amplitude & power values for a Two Sided FFT are only half of the values of the original time domain signal.
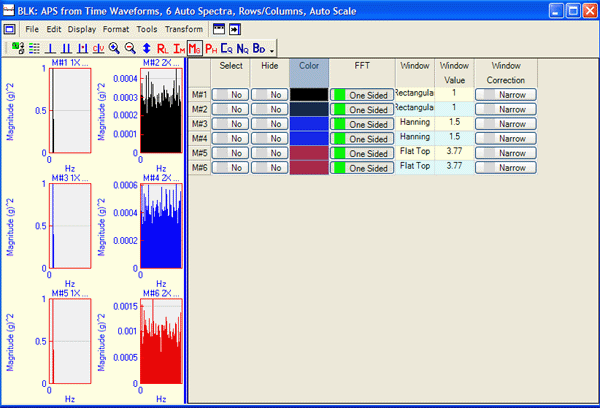
Describes the type of time domain window applied to all (or selected) M#s.
A Time domain window is applied by executing the Transform | Window M#s command.
Contains the window value corresponding to the window listed in the Window column.
The Exponential window value is the amount of damping added by the window (in Hz).
The Force window value is the number of samples following the beginning of signal where the Force window transitions to zero.
Used together with the Window and Window Value columns to correct the effects of time domain windowed from calculated spectra.
For each M# containing a narrow band signal, choose Narrow Band in the Window Correction column before applying a time domain window and calculating its spectrum.
For each M# containing a wide band signal, choose Wide Band in the Window Correction column before applying a time domain window and calculating its spectrum.
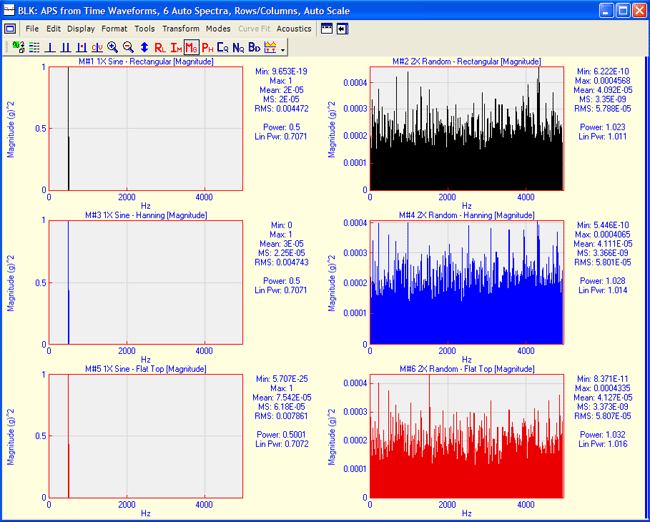
The figure below contains the spectra of 3 sine wave (narrow band) signals, and three random (wide band) signals.
Each M# was windowed using Rectangular, Hanning, and Flat Top windows before its Auto spectrum was calculated.
Notice that all of the magnitudes of the Sine Wave spectra (on the left side) are the same, even though each has been windowed with a different time domain window. Notice also that all of the magnitudes of the Random spectra (on the right side) are approximately the same, even though each has been windowed with a different time domain window.
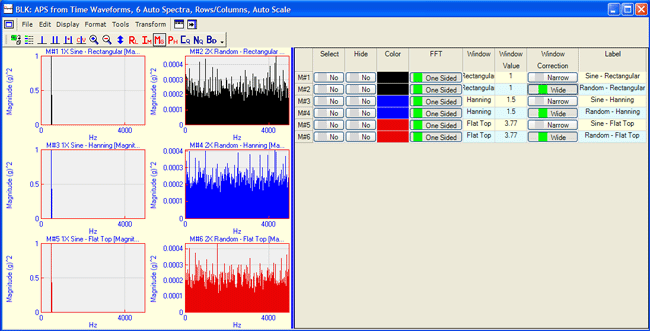
Narrow Band and Wide Band Spectra Amplitude Corrected for Windowing.
The figure below shows that the Power in all of the Sine Wave spectra is the same, since they have been Narrow Band corrected. Likewise, the Power in all of the Random spectra is the same, since they have been Wide Band corrected.
Narrow Band and Wide Band Spectra Power Corrected for Windowing.
This column is used to enter a Z-Axis text label for all (or selected) M#s.
M#s can be selected by their Z-Axis label using Edit | Select M#s | Select By so that only the data from M#s with the same label is displayed together in animation.