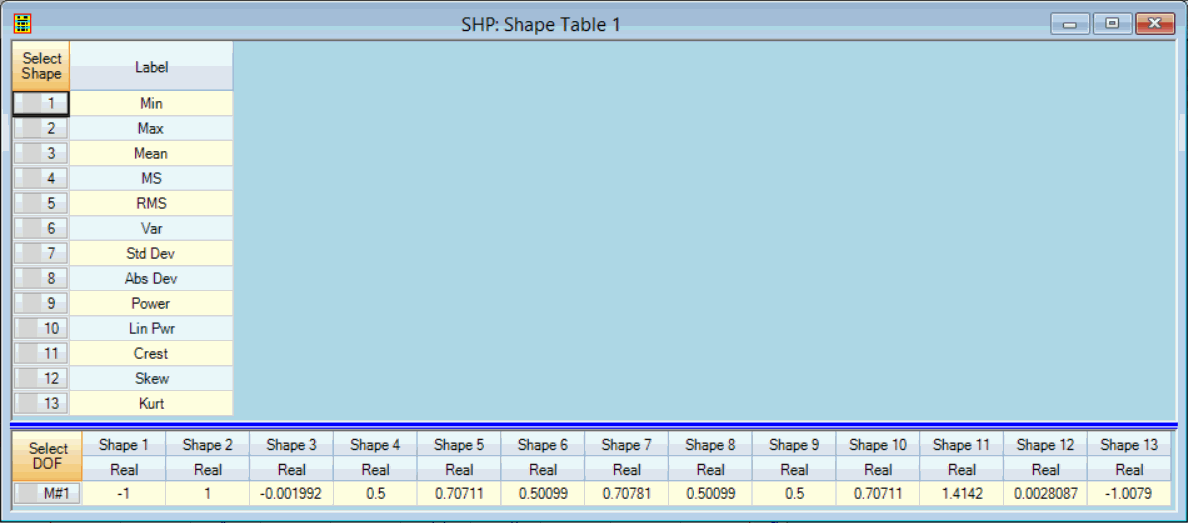
Saves the statistics of each measurement in a Data Block into a Shape Table.
Each statistic is saved as a different shape.
Each shape M# is the statistics value for the corresponding M# in the Data Block.
If the Band cursor is displayed, the statistics only for data in the band are saved.
If the data display is Zoomed, the statistics only for the displayed data are saved.
If the Real part, Imaginary part, or Phase of complex data is displayed, the statistics for that data are saved. Otherwise, the statistics of the Magnitude are saved.
The formula used to calculate each of the statistical values is given in the Tools | Statistics command definition.
Data Block Statistics Saved in a Shape Table Containing