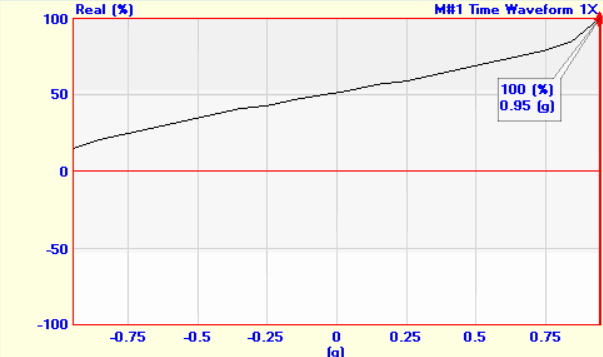
Calculates a Histogram (or Normal Distribution), and its Cumulative Distribution of the Y-Axis values in a Data Block. A Histogram is a count of the number of Y-axis values that lie between two values, referred to as a "bin"
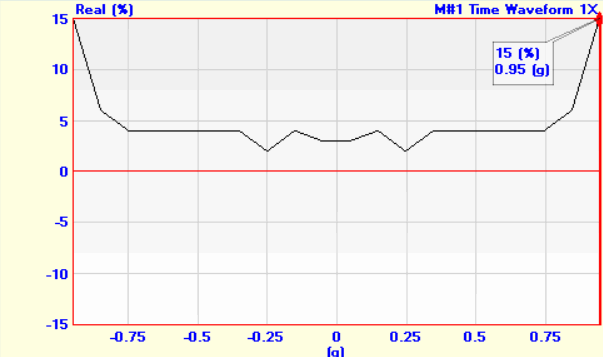
The Y-Axis of the Histogram is displayed as a percentage of the total number of values counted in all bins.
The X-Axis of the Histogram is the limits of the Y-Axis values in the Data Block divided by the number of bins.
If the Band cursor is displayed, the Histogram of the data in the band is calculated
If the data display is Zoomed, the Histogram of the Zoomed data is calculated.
If the Real part, Imaginary part, or Phase of complex data is displayed, the Histogram of that data is calculated. Otherwise, the Histogram of the Magnitude is calculated.
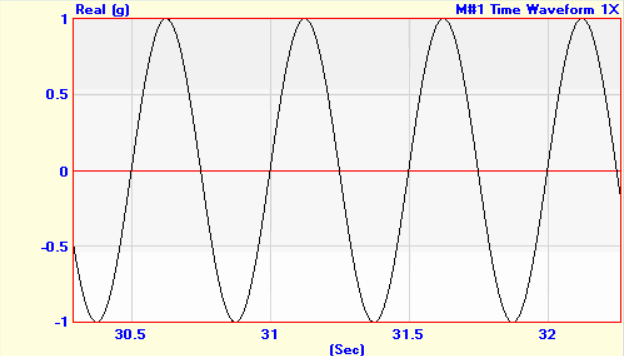
The figures below show a measurement of 10000 samples of sine wave data followed by its Histogram using 20 bins, and its Cumulative Distribution.

10000 Samples of Sine Data.

Histogram of the Sine Wave using 20 Bins.

Cumulative Distribution of the Sine Wave using 20 Bins.