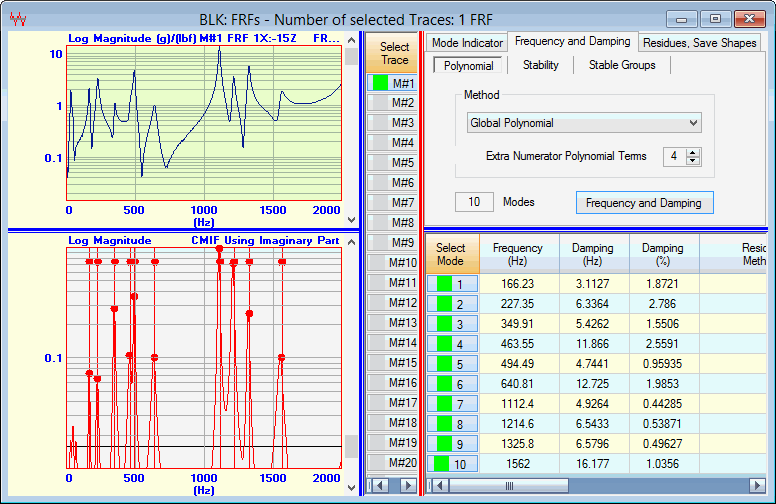
In many cases (especially with noisy data), it is better to build up a list of modal frequencies & damping in the Modal Parameters spreadsheet by curve fitting in small cursor bands using as few modes as possible. In this example, since the FRFs are relatively noise free, frequency & damping for all 10 resonance peaks will be estimated at once.
To estimate frequency & damping by curve fitting only the first M#,
Drag the vertical scroll bar (next to the graph) to its top most position to display the first M#.
Hold down the Ctrl key, and click on the graph to select the M#.
Notice that the graph background changes color to indicate the selected M#.
On the Frequency and Damping tab, make sure the Global Polynomial is selected in the Method list on the Polynomial tab
Press the Frequency and Damping button on the Polynomial tab
Click on No and then Yes in the dialog boxes that open.
Frequency & damping estimates for 10 modes will be listed in the modal parameters spreadsheet, as shown below.

Frequency & Damping Curve Fit of One Trace.
The frequency estimate for each mode in the Modal Parameters spreadsheet is displayed as a vertical line on the Mode Indicator graph.
Display the Band Cursor and surround several of the vertical lines on the Mode Indicator
Notice that the corresponding modes are selected in the Modal Parameters spreadsheet
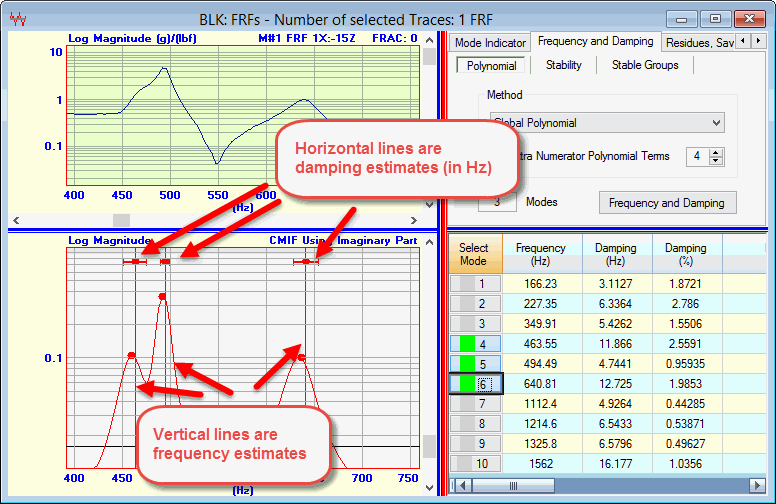
The damping estimate for each mode is displayed as a horizontal line crossing the vertical frequency line where,
Width of the Damping Line = 2s, s = half power point (or 3 dB point) damping (in Hz)
The half power point damping (2s) is approximately equal to the width of the resonance peak at 70.7 % of the FRF peak magnitude value. Alternatively, the half power point damping (2s) is approximately equal to the width of the resonance peak at half (50%) of the FRF peak magnitude squared. The FRF magnitude squared is considered a power quantity, hence the name half power point damping.
Execute Display | Zoom ![]() and zoom the display around several resonance peaks, as shown below.
and zoom the display around several resonance peaks, as shown below.

Zoomed Display of Frequency & Damping Estimates.
Even though frequency & damping can be estimated from one FRF, more accurate estimates are usually obtained by doing a Global curve fit on all (or several selected) FRFs.
Double click on the Select Mode column in the Modal Parameters spreadsheet until all modes are selected
Execute Curve Fit | Delete SELECTED Modes ![]() to delete the selected modes from the Modal Parameters spreadsheet.
to delete the selected modes from the Modal Parameters spreadsheet.
Hold down the Ctrl key and click on the selected Trace to un-select it.
Press the Frequency and Damping button again on the Polynomial tab
Click on Yes in the dialog box that opens.
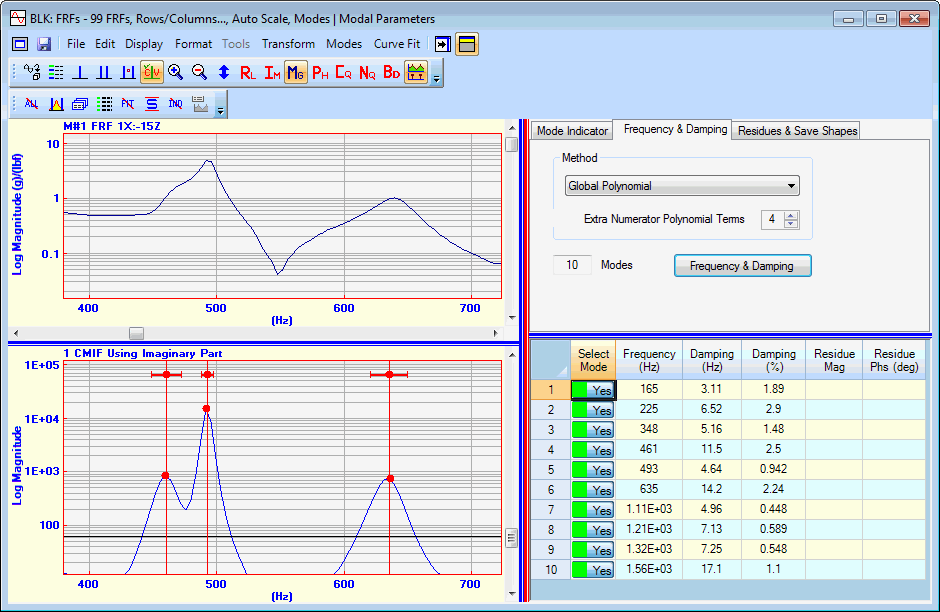
Now frequency & damping estimates extracted by curve fitting all 99 FRFs, are added to the Modal Parameter spreadsheet.

Global Frequency & Damping Estimates from 99 FRFs.