Displays a Magnitude Ranking bar chart in a separate window
This command can be executed from a Data Block or Shape Table.
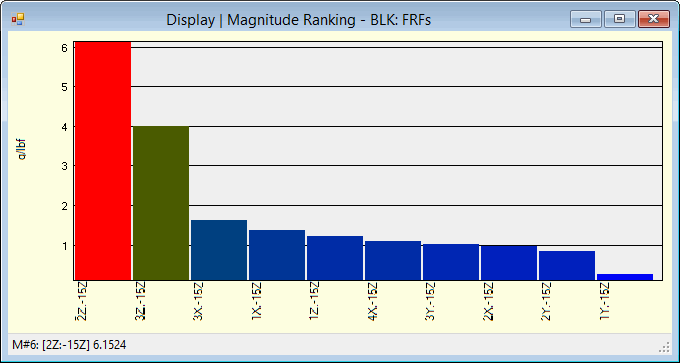
This bar chart displays the magnitudes of the measurement values at the current cursor position, or of all measurement values if no cursors are displayed.
M# magnitudes are plotted on the vertical axis versus M#s (and non-zero DOFs) on the horizontal axis.
The magnitudes are ranked from the largest on the left to the smallest on the right.
The Magnitude Ranking chart is updated when the cursor is moved, or when different M#s are selected.
The Contour Colors defined in the File | Data Block Options box are used for the Bar colors
Magnitude Ranking Chart.
If the Real part of the measurements is displayed, the Real parts are ranked.
If the Imaginary part of the measurements is displayed, the Imaginary parts are ranked.
Otherwise, the magnitudes of the measurements are ranked.
Hover the mouse pointer over a magnitude bar to display its value at the bottom of the window.
This bar chart displays the magnitude of all (or selected) shape components (M#s), ordered from the largest to the smallest.
Shape component magnitudes are plotted on the vertical axis versus M#s on the horizontal axis.
The magnitudes are ranked from the largest on the left to the smallest on the right.
The Contour Colors defined in the File | Shape Table Options box are used for the Bar colors
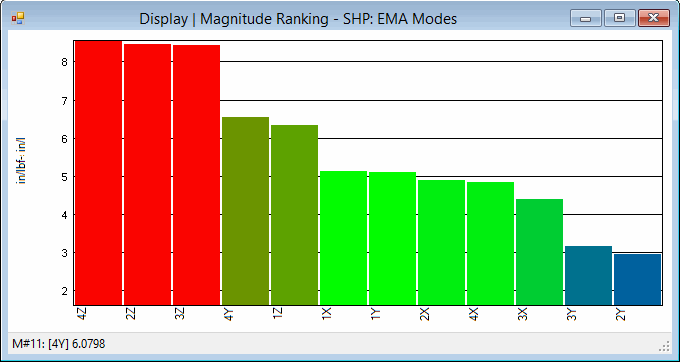
Shape Magnitude Ranking Chart.
If the Real parts of the M#s are displayed, the Real parts are ranked.
If the Imaginary parts of the M#s are displayed, the Imaginary parts are ranked.
Otherwise, the magnitudes of the M#s are ranked.
Hover the mouse pointer over a magnitude bar to display its value at the bottom of the window.