The first step of modal parameter estimation is to determine how many modes are represented by resonance peaks in a set of FRF measurements.
A number of modes is required by the Local & Global polynomial curve fitting methods on the Frequency & Damping tab.
The Mode Indicator tab is used to;
Calculate a Mode Indicator function.
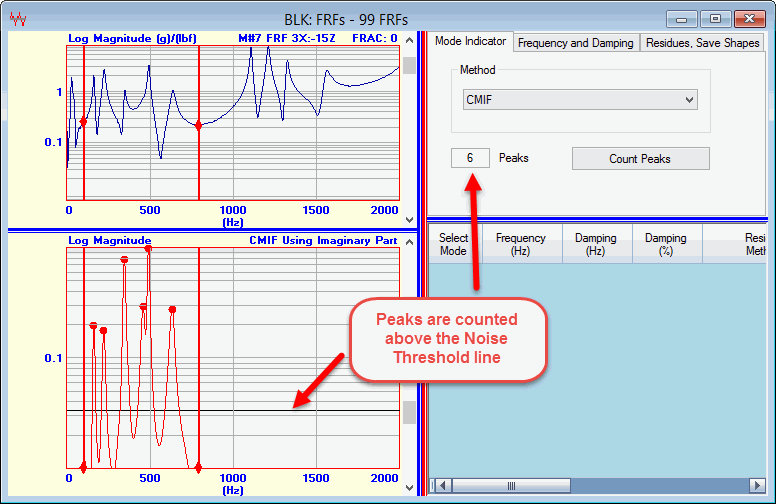
Count the peaks above a Noise Threshold Line on the Indicator graph as shown below.

Mode Indicator Tab
The Mode Indicator is used for two purposes,
To provide a single curve for counting the number of resonance peaks in a frequency band.
To limit the Frequency & Damping curve fitting methods to using the data surrounding each resonance peak.
The Mode Indicator is calculated by processing either the Real part, Imaginary part, or Magnitude of all (or selected) M#s in a Data Block
To calculate the Mode Indicator function and count its peaks,
Choose an Indicator from the Method drop down list on the Mode Indicator tab.
Press the Count Peaks button. A dialog box will open allowing you to choose a part of the measurement data to use for calculating the Mode Indicator.
Choose the Imaginary part when it has a single resonance peak for each mode. (With FRFs, this occurs when the response units are Displacement or Acceleration.)
Or choose the Real part when it has a single resonance peak for each mode. (With FRFs, this occurs when the response units are Velocity.)
Or choose Magnitude when neither criterion for choosing the Real or Imaginary part is valid.
When the Count Peaks button is pressed, the following actions occur,
A graph of the Mode Indicator is displayed in the lower left corner of the window.
The peaks above the horizontal Noise Threshold line on the Mode Indicator graph are counted. Each modal peak is indicated with a red dot on the Mode Indicator curve.
The number of peaks counted is displayed in the Peaks box on this tab, and the Modes box on the Frequency & Damping tab.
If you move either the Noise Threshold or the Band cursors, peaks will be counted again on the Indicator graph.