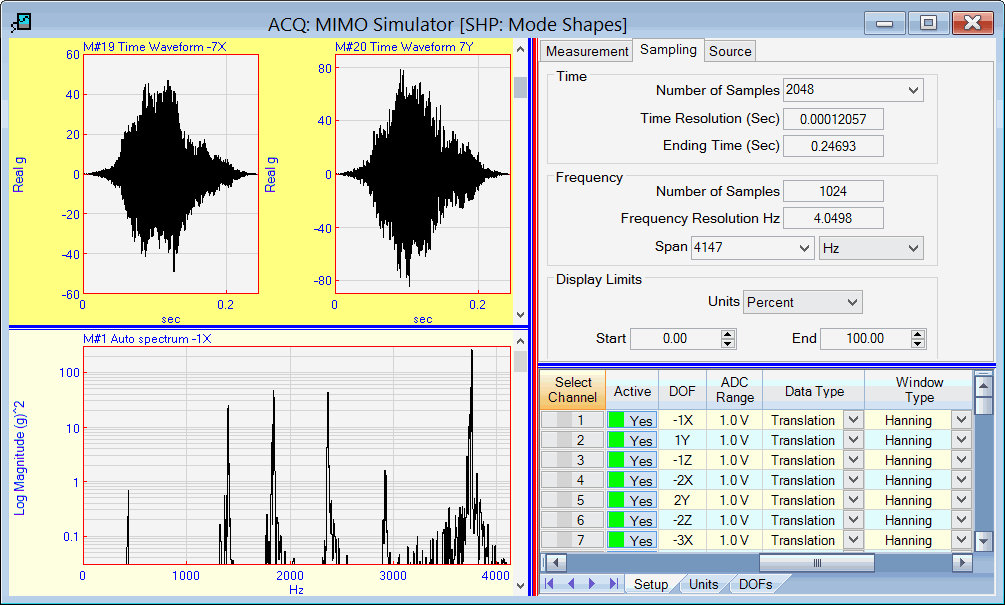
Right-click on the upper or lower graph to make it active.
Or click on the command tool to make the upper ![]() or the lower
or the lower ![]() graph active
graph active
This menu is also displayed when you right-click in the graphics area in an Acquisition window
Centers the Acquisition window in the Work Area of the ME'scope window.
Repeated execution of this command alternately centers the window and returns it to its former position.
Moves the vertical blue splitter bar either to the left to display the M#s spreadsheet, or to the right to hide it.
The M#s spreadsheet for either the upper or lower graph are displayed by pressing Upper M#s or Lower M#s at the bottom of the M#s spreadsheet
If checked, the Toolbars are displayed in the Acquisition window.
Toggles the active graph area between the upper and lower graph.
The properties of the measurements in the active graph are shown in the M#s spreadsheet.
Right-click on the upper or lower graph to make it active.
Or click on the command tool to make the upper ![]() or the lower
or the lower ![]() graph active
graph active
Initiates a Zoom operation on the active graphs. mooZ restores the display of all samples of data in the active graphs
See Display | Zoom, mooZ in the Data Block Window Commands chapter for more details.
Maximizes the vertical (Y-axis) display of each active graph to make the data more visible.
See Display | Maximize in the Data Block Window Commands chapter for more details.
See the Display | Fill Under Graph commands in the Data Block Window Commands chapter for more details.
Displays the time waveforms in the upper graph area following the application of a time domain window to them.
If checked, the windowed time waveforms are displayed.
If not checked, the time waveforms are displayed without the window applied
NOTE: The time domain window is chosen in the Window Type column of the Channels spreadsheet. If Rectangular (or no) window is chosen, no time domain widow is applied to the waveforms.

Upper Graph Time Waveforms After the Hanning Window was Applied.