Opens the Shape Difference Indicator (SDI ) window from a Shape Table.
Each Shape Table can contain ODS's, FEA Mode Shapes, EMA Mode Shapes, or Engineering Data Shapes.
A Shape Difference Indicator value is a quantitative measure of the difference between two complex shape vectors, {u} and {v}. SDI values range between 0 & 1;
SDI = 1.00 - means the two shapes are identical.
SDI > 0.90 - means the two shapes have similar values
SDI < 0.90 - means the two shapes have different values
SDI is calculated between two shapes {u} and {v} using the formula;

where:
|| || - denotes the magnitude squared of the vector.
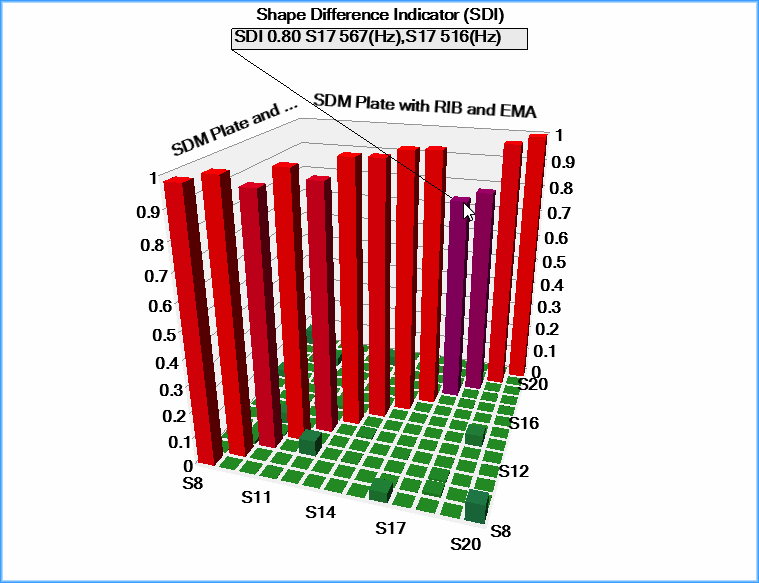
SDI values between pairs of shapes in two Shape Tables are displayed in this window.

SDI 3D Bar Chart.
WARNING: Only the shape components with matching shape DOFs in the two Shape Tables are used to calculate SDI values.
Copies the SDI window graphics to the Windows Clipboard.
Prints the graphics on the system graphics printer.
Closes the SDI window.
Displays the SDI values in a spreadsheet.
Displays the SDI values in a 3D bar chart.
Click & drag to rotate the 3D Bar Chart.
When checked, the SDI value for one shape pair is displayed on the 3D Bar Chart.
Hover the mouse pointer over a bar to display its value.
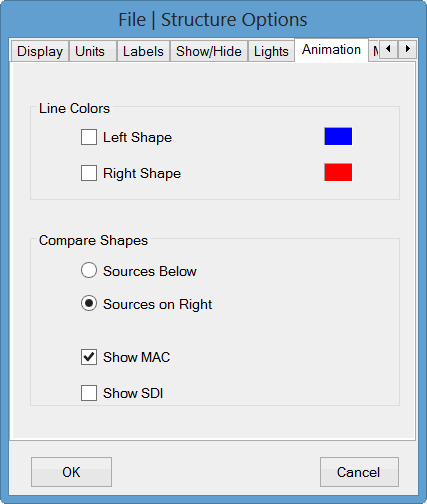
A Show SDI control is added to the Animation Tab in the File | Structure Options box when this option is enabled.
If Show SDI is checked, the SDI value between the two shapes is displayed during Comparison animation.
