This menu is also displayed when you right-click in the graphics area.
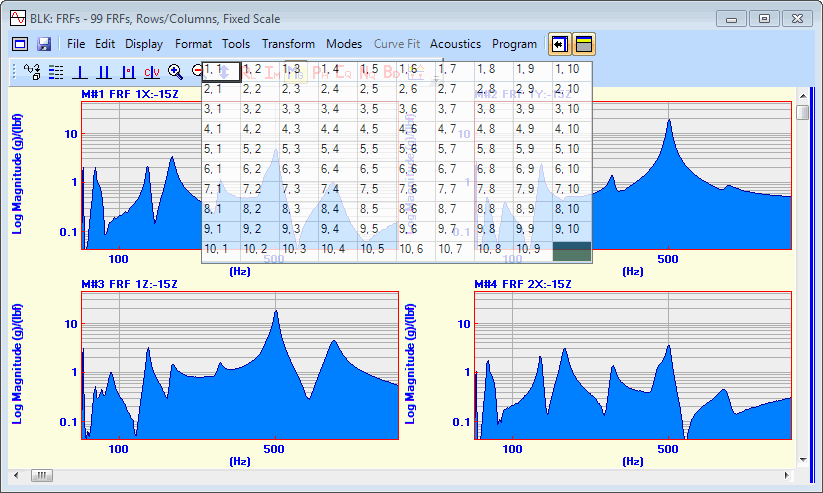
Displays M#s in a Row & Column format. When it is executed, a matrix of (row, column) format selections is displayed, as shown below.
Up to 10 rows and 10 columns can be displayed at once.
If there are more than 100 M#s in the Data Block or less than 100 M#s are displayed, a vertical scroll bar is displayed on the right hand side of the graphics area for scrolling through the M#s.

M#s in Row/Column Format.
Displays up to 10 M#s together with a common X-Axis below them.
If there are more than 10 M#s in a Data Block or less than 10 M#s are displayed at once, a vertical scroll bar is displayed on the right hand side of the graphs area for scrolling through the M#s.
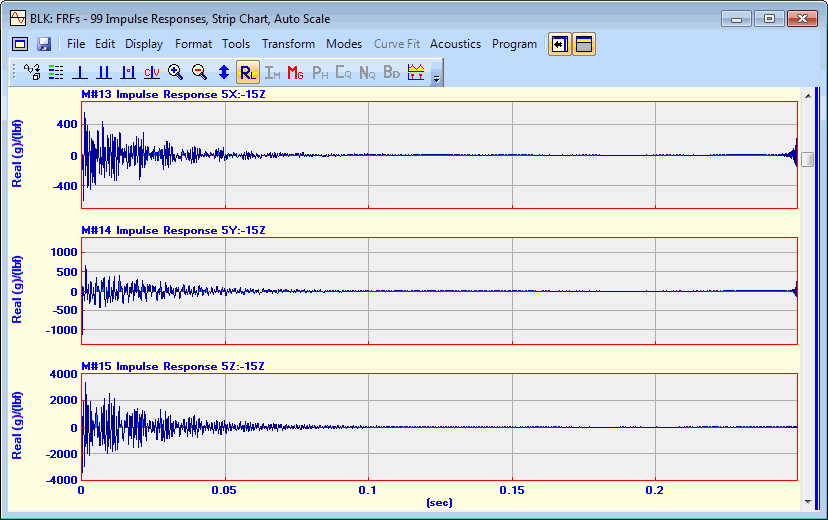
Strip Chart Showing Three M#s.
Displays all (or selected) M#s in overlaid format.
The Y-Axis scaling is changed to Relative when this command is executed. (See Format | Y-Axis for details).
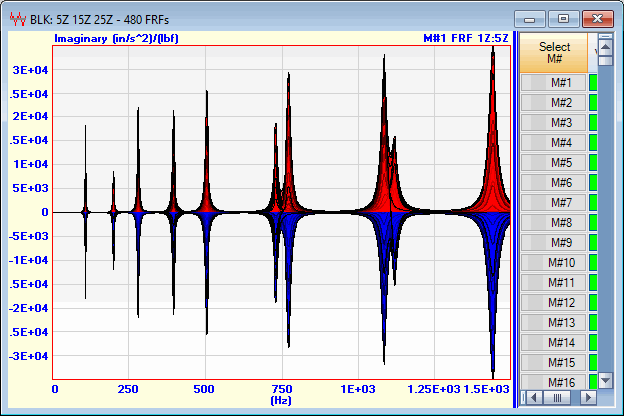
Imaginary Parts of FRFs in Overlaid Format.
If checked, all (or selected) M#s with the same Roving DOF are displayed together in Overlaid format. This command is useful for displaying FRFs & Coherences together in overlaid format.
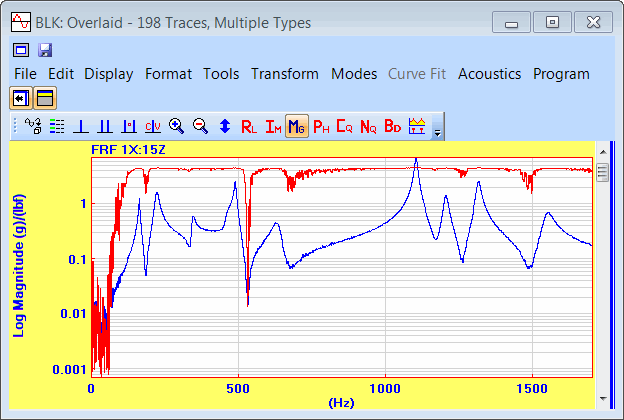
FRFs & Coherence Overlaid by DOF.
Displays all (or selected) M#s in a Cascade plot.
To change the angle of the Cascade axes, place the mouse pointer on the Cascade Plot, hold down the right mouse button, and drag the mouse.
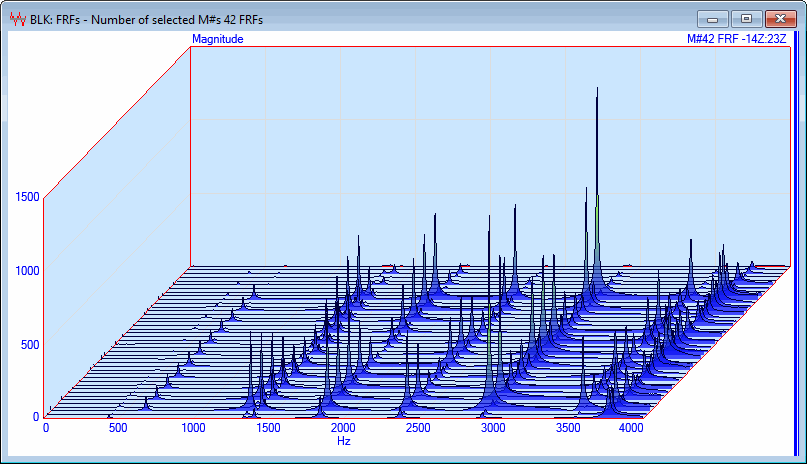
Cascade Plot.
Displays all (or selected) M#s in a color contour map.
The colors used for the contour map are chosen in the Contour Colors tab in the File | Data Block Options dialog box.
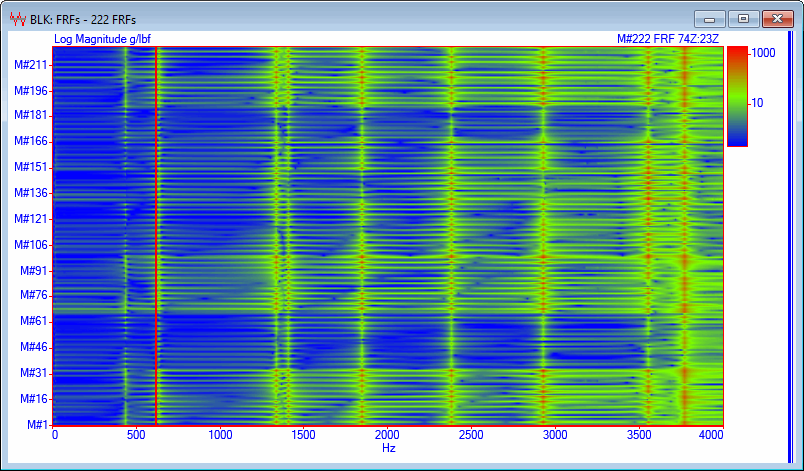 Cascade Map Showing 14 Selected M#s.
The vertical axis is labeled using either M#s or DOFs, which are chosen in Scroll Tip section on the Labels & Grids tab in the File | Data Block Options box.
Opens the Y-Axis format dialog box, which is used for formatting the Y-axis of the graphics display. This dialog box can also be opened by,
Right clicking in the graphics area, and executing Format | Y-Axis from the menu.
Or double clicking on the Y-Axis area of the graphics display.
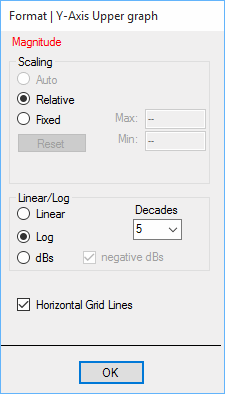
Auto Scale displays each M# between its minimum & maximum values.
Relative Scale displays each M# between the minimum & maximum values of all M#s in the Data Block.
Fixed Scale displays each M# between user-defined minimum & maximum limits.
Fixed scaling limits can be defined for the following display formats,
Real part, Imaginary part, Linear Magnitude, Log Magnitude, Magnitude in dB, or Phase.
Each M# can be scaled by editing its cells in the Y-axis Scale, Fixed Minimum & Fixed Maximum columns of the M#s spreadsheet.
Select the M#s to be scaled.
Double click on the Y-axis Scale column heading.
Choose the scaling method in the dialog box that opens, and click on OK.
If Fixed scaling is chosen, the Fixed Minimum & Fixed Maximum limits must be entered into their respective columns in the M#s spreadsheet.
Magnitudes can be displayed in dB (decibels) units. For Linear (RMS) quantities, (such as FRFs, Fourier Spectra, etc.) the Magnitude is displayed as,
Magnitude (dB) = 20 Log 10( Magnitude )
For Power (MS) quantities (such as Auto & Cross Spectra), the Magnitude is displayed as,
Magnitude (dB) = 10 Log 10( Magnitude )
Same as the choices on the Labels & Grids tab in the File | Data Block Options box.
Opens the X-Axis dialog box which is used for formatting the X-axis of the graphics display. This dialog box can also be opened by,
Right clicking in the graphics area, and executing Format | X-Axis from the menu.
Or double clicking on the X-Axis in the graphics area
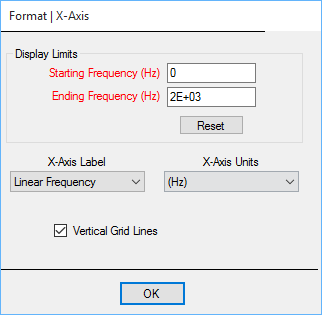
The Starting & Ending limits of the X-Axis display.
All M#s are displayed between the Display Limits unless the Reset button is pressed.
These two drop down lists define the X-Axis for all M#s in a Data Block.
Time domain measurements can be displayed as Linear Time, Log Time or Samples, with Units of Seconds, Milliseconds or Micro-seconds.
Frequency domain measurements can be displayed as Linear Frequency, Log Frequency or Samples, with units of Hz, CPM, RPM or Orders.
Same as the choices on the Labels & Grids tab in the File | Data Block Options box.