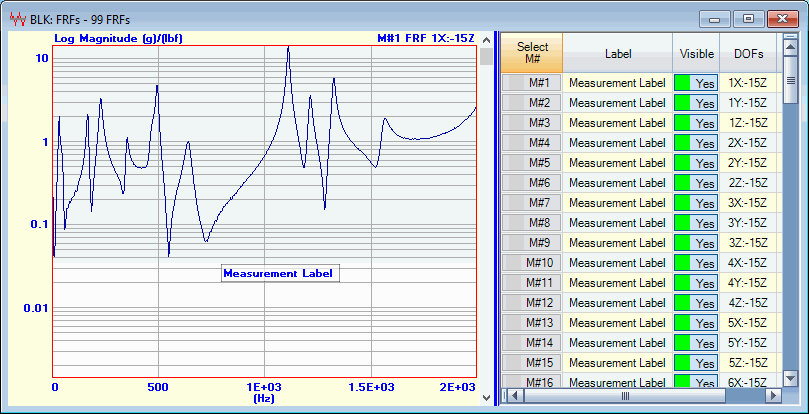
This menu is also displayed when you right-click in the graphics area.
Centers the window in the Work Area of the ME'scope window.
Repeated execution of this command alternately centers the window and returns it to its former position.
Moves the vertical blue splitter bar either to the left to display the M#s spreadsheet, or to the right to hide the spreadsheet.
If checked, the Toolbars are displayed in the Data Block window.
Displays the M# Label on each M# graph.
M# Labels are viewed and edited in the M#s spreadsheet.

M# Label Displayed on a Graph.
Zoom expands the display of the M#s in the graphics area by displaying fewer samples. mooZ restores the display of all samples.
Execute Display | Zoom to enable a Zoom operation
Move the mouse pointer into the graphics area
The mouse pointer will change to (<=>)
Click & drag to draw a Zoom box over the area to be zoomed
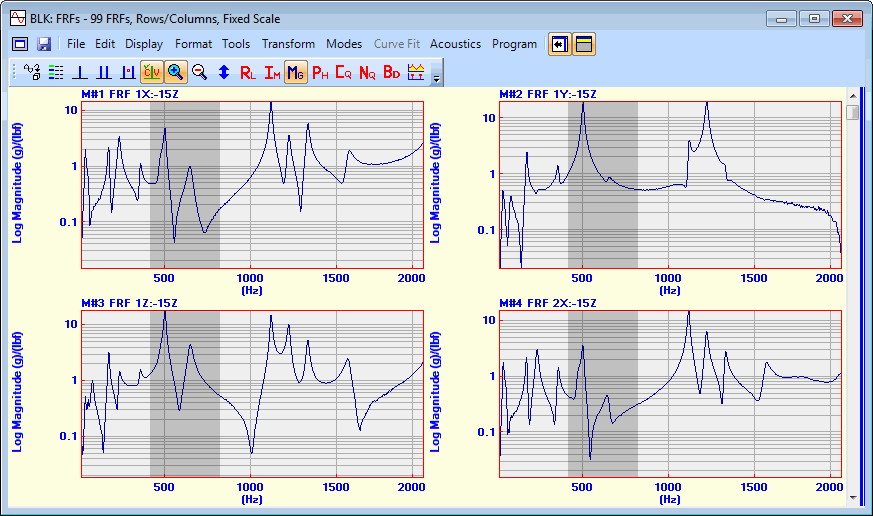
Graphs During a Zoom Operation.
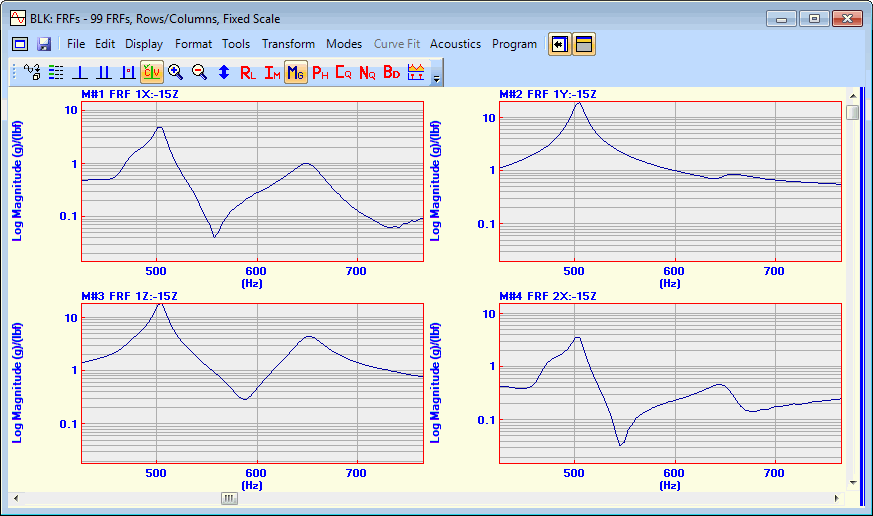
Graphs After Zoom.
Move the mouse pointer into the graphics area
Click on the point to be zoomed about, and spin the mouse wheel
The display will expand in the horizontal direction about the mouse position
After executing the Zoom command
Hold down the Ctrl key
The mouse pointer will change to (+)
Click & drag to draw a Zoom box over the area to be zoomed
When the graphics display is zoomed, a horizontal scroll bar is displayed at the bottom of the graphics area. To pan the display along the X-axis direction,
Use the horizontal scroll bar
Or Hold down the Shift key, and click & drag the mouse in the graphics area
Maximizes the Y-Axis display of the measurements in the graphics area to make the data more visible.
If M#s are selected, then only the selected M#s are maximized.
If the Peak or Band cursor is displayed, the data in the cursor band is maximized.
If the Real or Imaginary part of the measurements is displayed,
Successive execution of this command changes the display between plus (+) and minus (-) limits of the data and the vertical axis centered about the zero "0".
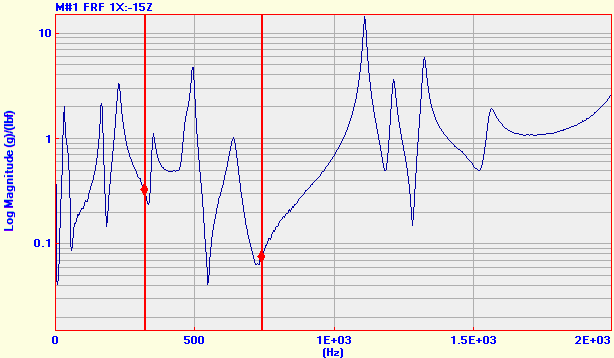
Graph Before Maximizing in a Cursor Band.
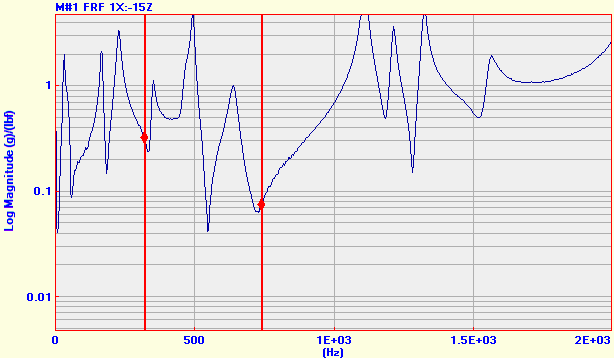
Graph After Maximizing in a Cursor Band.
If checked, each M# color is used to fill under each graph.
Each M# color is selected in the Color column of the M#s spreadsheet.
If checked, the + Fill & - Fill colors on the Display tab of the File | Data Block Options box are used to fill under each graph.
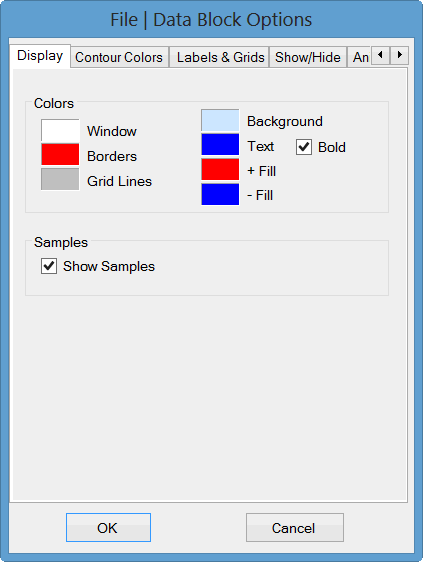
Display Tab Showing Fill Colors.
If checked, the colors on the Contour Colors tab of the File | Data Block Options box are used to fill under each graph.
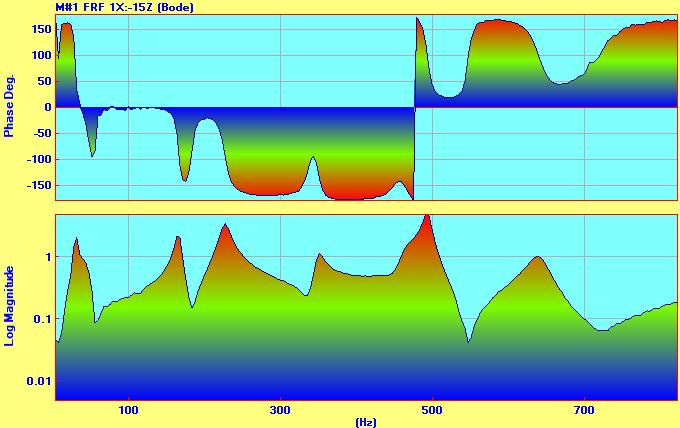
Bode Plot Using Contour Colors to Fill Under the Graph.